The preceding chapter has dealt with the input to the hydrological cycle – rainfall – and its variation in time and space in response to various climatic factors. This chapter attempts to explain what happens to the rainfall once it reaches the ground. The science of hydrology is concerned with quantifying the various components into which rainfall is partitioned, and understanding the physical processes by which water is eventually returned to the atmosphere. The cycle through which rainfall passes before being returned to the atmosphere is termed the ‘hydrological cycle’. It is very complex and imperfectly understood. The cycle can be, and has been, modified radically in many places by man’s activities. It is subject to the vagaries of rainfall input and to climatic change. On the other hand, great strides have been made during the last 35 years in determining the nature of the physical processes and their interactions.
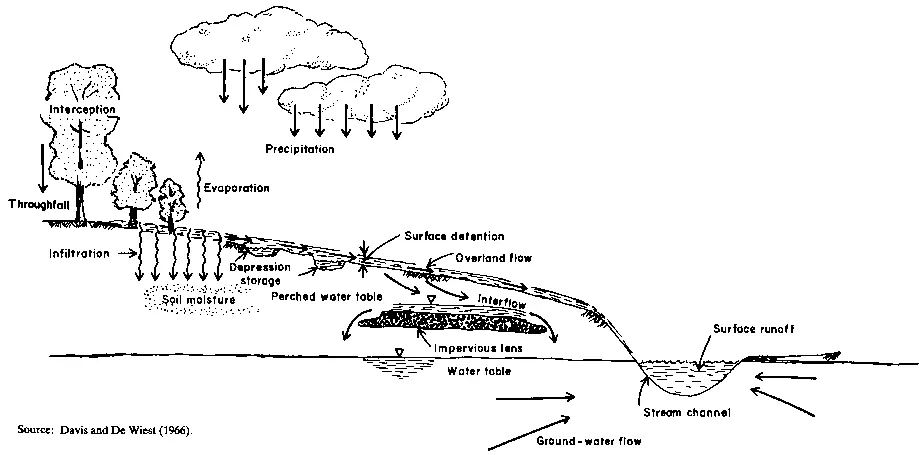
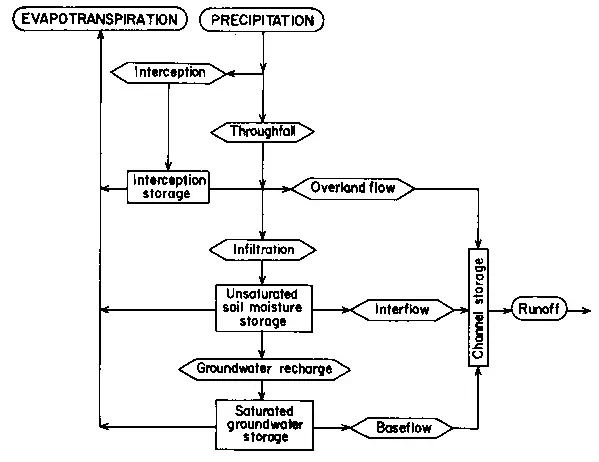
From an understanding of the hydrological cycle, quantitative estimates of the various components enable simple ‘water balances’ to be drawn up. It is in quantifying former unknowns in the hydrological cycle that experimental scientists have made the most progress. At the same time, analytical hydrologists have been remarkably successful in modelling the cycle – or approximations of it – both by conceptual and empirical models. Forecasting and prediction now can be accomplished successfully within acceptable errors of estimation. The value of such models, however, is dependent on the quality of input data. Thus, in areas of inadequate or inaccurate data it is not always possible to model the cycle with confidence. Examples of diagrammatic representations of the hydrological cycle can be found in most textbooks. Figure 12 is presented here because it emphasises the subsurface components which are often neglected. A conceptual or systems representation of the cycle is given in Figure 13, since this helps to simplify the relationships between components. Table 3 gives approximate values of the amount of water stored at various stages in the cycle. Of the world’s total water resources 94% are locked in the oceans and seas, at a high level of salinity, and in ice caps and glaciers. Of the remaining 6%, Freeze and Cherry (1979) estimate the relative volumes available as a utilisable resource as: groundwater 95%; lakes, swamps, reservoirs and river channels 3.5%; and soil moisture 1.5%.
Although the percentage for groundwater points towards it being the most important component of the cycle, it is not always the most accessible source of usable water. It is frequently mineralised or polluted and, if extracted in large quantities, can cause subsidence or saline intrusions. In the tropics, large areas are deficient in surface water, and therefore use of the subsurface resource becomes a necessity. Before discussing the exploitation of the various resources, however, it is important to consider the relationship between the different components of the cycle, in order to estimate those quantities which are difficult to measure directly. An example is groundwater recharge, which has a profound bearing on the renewable character of the resource.
Foresters have always observed the phenomena of interception and throughfall, but few have been prepared to acknowledge that these components were of great significance in the context of the hydrological cycle. Recent work (Stewart, 1977) has established that interception can play a major role in the water balance of catchments where the aerodynamic component of the energy balance is large relative to net radiation. In the tropics this is not likely to be the case, but there are indications that, even in forests lying cally astride the equator, evaporation of intercepted water can be a significant feature (Blackie, 1972; Blackie et al, 1979).
Intercepted moisture, stored in the canopy, is the first component of the hydrological cycle to be lost directly back to the atmosphere. In areas of high wind speed, with aerodynamically ‘rough’ canopies, this loss can be very rapid and, in areas where the canopy is frequently wetted, the total quantity of intercepted water lost by evaporation can be a significant proportion of the total rainfall. Interception of raindrops by canopies is also a major factor in reducing soil erosion. This has an indirect effect on the hydrological cycle, in that, by conserving surface soil, infiltration is maintained.
In areas of shorter vegetation interception storage is likely to be small, and the rate of loss may not exceed the potential evaporation rate. Thus in rangelands, interception storage is unlikely to be a measurable quantity in the water balance. Many dry-season grazing areas, however, depend on perennial springs for water supply. These springs emanate from hillsides covered in vegetation, where interception protects the slopes through which the springs are being recharged. Throughfall, stemflow and drip (including the so-called occult precipitation described in Section 2.8) form the precipitation input. In dense canopies throughfall is of minor importance, and hence the rate at which water is received by the soil surface is within its infiltration capacity. Surface runoff is practically nil on the heavily forested slopes, and deep percolation is often rapid, through fractured or weathered bedrock. These advantages in terms of recharge, however, have to be offset against the transpiration of deep-rooted, perennial vegetation which tends to produce moisture deficits in the root zone. These deficits inhibit deep infiltration until sufficient rain falls to saturate the root zone.
Table 3. Estimate the water balance of the world.
| Parameter | Surface area (km2x106) | Volume (km3x106) | Volume (%) | Equivalent depth (m)a | Residence time |
| Oceans and seas | 361 | 1370 | 94 | 2500 | ~4000 years |
| Lakes and reservoirs | 1.55 | 0.13 | <0.01 | 0.25 | ~10 years |
| Swamps | <0.1 | <0.01 | <0.01 | 0.007 | 1-10 years |
| River channels | <0.1 | <0.01 | <0.01 | 0.003 | ~2 weeks |
| Soil moisture | 130 | 0.07 | <0.01 | 0.13 | 2 weeks – 1 year |
| Groundwater | 130 | 60 | 4 | 120 | 2 weeks – 10 000 years |
| Icecaps and glaciers | 17.8 | 30 | 2 | 60 | 10-1000 years |
| Atmospheric water | 504 | 0.01 | <0.01 | 0.025 | ~10 days |
| Biospheric water | <0.1 | <0:01 | <0.01 | 0.001 | ~1 week |
a Computed as through storage were uniformly distributed over the entire surface of the earth.
Source: Nace (1971).
Over most of the rangelands in tropical Africa infiltration is the key process in the hydrological cycle. Infiltration capacity (Horton, 1933) or infiltrability (Hillel, 1971) define the rate at which water can enter the soil. Horton recognized both a maximum and a minimum infiltration capacity of soils; the maximum being at the onset of rainfall with the capacity decreasing as the impact of raindrops changes the surface structure of the soil (Bayer, 1965). Philip (1969) has approximated the physical process of infiltration by means of the equation:

where
I = infiltration volume at time t;
S = sorptivity, a parameter proportional to the square root of the water diffusivity and to the increase in soil water content during infiltration; and
K = hydraulic conductivity of the soil.
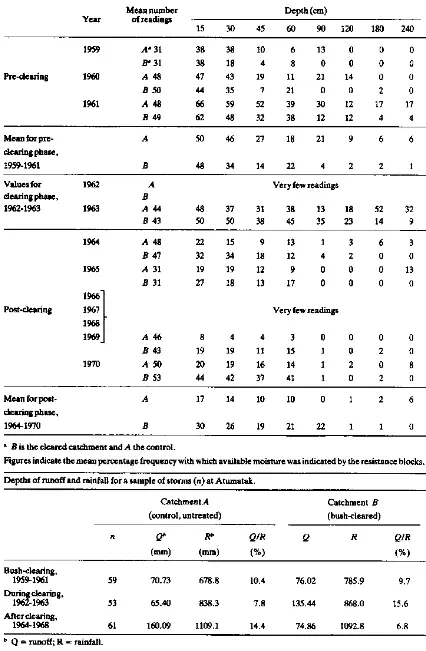
For a more rigorous description of the infiltration process see Philip (1969), Hillel (1971) and Morel Seytoux and Khanji (1974). Clack and Larson (1981) give a discussion of modelling infiltration. When the rate of rainfall exceeds the infiltration capacity of the soil, the result is surface runoff, unless the surface water is stored in depressions (surface or depression storage). Thus, management for soil conservation is directed both at maintaining high infiltration rates by preserving a good surface cover, and at increasing surface storage by pasture furrows, cut-off ditches, and range pitting or water spreading (Hudson, 1971). One of the additional problems in grazing areas is that of ‘puddling’. Puddling is the structural change associated with mechanical stress while soils are in a moist condition, and results in the destruction of large pores in the soil through which water percolates. This has the effect of decreasing infiltration capacity and increasing surface runoff. Further mechanical sorting results, together with the removal of organic material and, often, surface sealing (Thomas et al, 1981). In fact, these authors found that from different types of land use in a catchment in Machakos, Kenya the greatest loss of soil was from degraded grazing areas. Much of this can be attributed to loss of vegetation from overgrazing and the downward spiral of poor vegetation leading to high rates of soil loss and surface runoff (Hudson, 1971).
With some soils, subsoil permeability may be the limiting factor in determining infiltration rates (Greenland, 1979). While this points to surface management being less important, experimental evidence shows that the compaction of well structured surface layers in tropical forest soils, such as that following clearing, causes infiltration capacity to drop by half. Although infiltration can be seen to be a key process in the cycle, very few experimental data are available to quantify infiltration capacity. It is known to be (spatially) highly variable, and for this reason isolated measurements are of little practical benefit. Indirect evidence of the improvement of infiltration, following the re-establishment of grass cover, can be found in Edwards and Blackie (1981), who report the results of the Atumatak catchment experiment in Karamoja, Uganda from 1959 to 1970. Two adjacent degraded catchments were chosen for this experiment. One was fenced, cleared of secondary bush and subjected to a controlled grazing-density scheme. The other continued under uncontrolled grazing conditions. Soil moisture tension blocks were installed at a number of sites and, from an analysis of the measurements (Table 4), it was clear that, in the post-clearing phase, infiltration penetrated down to a depth of 60 cm at most sites. A corollary to the recovery in infiltration in the cleared catchment was the reduction in storm runoff to half that in the ‘control’ catchment – a striking example of rapid recovery following a modest management programme.
The problem of measuring evaporation from open water surfaces, and transpiration from different types of vegetation, has been a central problem in hydrology for many years. In terms of the hydrological cycle and the water balance, evaporation and transpiration make up the second largest component. Errors in estimating evaporative loss, therefore, assume great significance, for example, in the calculation of groundwater recharge. Difficulties in understanding the physical nature of the evaporation process, together with ambiguous results from the various types of instrument designed to measure evaporation directly (such as evaporation pans and evaporimeters), led to the development of empirical techniques for estimating evaporation, using generally available climatic data (Thornthwaite, 1948; Blaney and Criddle, 1950; Turc, 1955). These techniques were recognized and acknowledged to give only approximate estimates, but in the absence of simple-to-apply, more theoretically sound methods they provided a useful means of calculating irrigation need and consumptive water use by crops.
Advances in micro-meteorology have produced more sophisticated techniques for measuring evaporation. Generally speaking, these are still research techniques requiring far more instrumentation or experimental data than are normally available. Perhaps the best compromise is the semi-empirical but physically based formula of Penman (1948; 1952; 1956; 1963), or its many derivatives (Monteith, 1965; Thom and Oliver 1977). This embodies the concepts of ‘potential transpiration’ (ET) from vegetation plentifully supplied with water, and of ‘open-water evaporation’ (EO) from an extensive open-water surface. The original formula (Penman, 1948) is a combination of the energy balance and aerodynamic methods of measuring evaporation. The energy quantities available for evaporation and for heating the soil-plant-atmosphere system can be equated:
Rn = l E + K + G
where
Rn = net radiation,
l E = latent heat flux,
K = sensible heat transferred to the air, and
G = sensible heat transferred to the soil.
In tropical regions G becomes small in relation to Rn over a day, and may be neglected. Rn can be measured or estimated from incoming solar radiation (Rc), or hours of bright sunshine (Grover and McCulloch, 1958), and the problem becomes that of partitioning Rn between sensible heating of the air and the latent heat flux. The ratio K/l E is known as the Bowen ratio (b). Penman derived an estimate for b by introducing an empirical aerodynamic term Ea and eliminating the need to measure surface temperatures. Evaporation from an open-water surface (EO) is then given by:
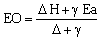
where
Ea = f(u) (1 + u2/100) (ea-ed),
H = (Rn-G) l,
D = the slope of the curve relating saturation vapour pressure to air temperature at mean air temperature,
g = the psychometric constant,
f(u) = an empirical constant,
u2 = run-of-wind at 2 m height above the ground, and
ea, ed = saturation vapour pressure at air temperature and dew point respectively.
On the basis of the Lake Hefner experimental results (US Navy, 1952), Penman modified the aerodynamic term to:
Ea = f(u) (0.5 + u2/100) (ea – ed)
justifying the correction on the grounds that the new term gave better agreement with evaporation from a large body of water (Penman, 1956).
To estimate ET, Penman first used a reduction factor which varied seasonally. Averaged over the whole year, a value of 0.75 was derived for western Europe. At a later stage, making use of measurements of the albedo of grass, and reinstating the original aerodynamic term to take into account the aerodynamic roughness of short vegetation, a one-step formula was introduced:
(Penman, 1963)
where
Eat = f(u) (1 + u2/100) (ea – ed), and
H = (Rn – G)/l, with Rn now measured over grass.
This formula has been used to provide an index of evaporation. In practice, it can be expected to give reasonable estimates of ET within the accuracy of the other components of water balance, where water supply to the root zone is not a limiting factor (Edwards and Rodda, 1970; Blackie et al, 1979). Regional maps of potential evaporation have been produced for Kenya (Woodhead, 1968a), Tanzania (Woodhead, 1968b) and Uganda (Rijks et al, 1970), and the formula is now widely used in modelling the water use of crops (Doorembos and Kassam, 1979).
Simplified calculation methods for the Penman formula can be found in McCulloch (1965), Berry (1964) and Doorembos and Pructt (1977). Further modifications of the approach can be found in Monteith (1965) and Thom and Oliver (1977).Where water supply to the root zone is a limiting factor, as in most of the semi-arid tropics, actual evaporation (AK) is considerably less than potential evaporation (PE). The direct methods of measuring AE require complex and expensive equipment, and the indirect methods, such as the water balance of watertight catchments, do not give short-period water use unless soil moisture measurements are available. An alternative approach has been developed by Bouchet (1963), and embodies the concept of complementary evaporation. Broadly speaking, this concept states that the difference between AE at a dry site and PE at a wet site, subject to the same radiation input (where water supply is not limiting), is the same as the difference between PE estimated at the dry site (i. e. with the same radiation input but lower humidities and higher air temperatures) and PE calculated for a wet site. This can best be illustrated by a diagram (Figure 14), in which annual evaporation is plotted against annual rainfall. The theoretical values of PE are seen to decrease with increasing rainfall at the drier site (location A) until they reach a value PEo, which is a function of radiation input, temperature and humidity, where soil moisture is not limiting (location B). Variations in the theoretical values of AE are the precise opposite, increasing with increasing rainfall until they reach the same limiting value of PEo.
Figure 14. Relationship between actual evaporation, potential evaporation and annual rainfall
Brutsaert and Stricker (1979) used the Priestley-Taylor equation (Priestley and Taylor, 1972) to calculate PEo. The formula which was developed to estimate evaporation in the absence of advection reads:
They used the Penman formula to estimate the local potential evaporation (PEB). AE can now be found from the Bouchet relationship:
AE = 2PE – PEB
This approach was tested by Stewart et al (1982), together with an improved Penman formula incorporating a larger aerodynamic term (Thom and Oliver, 1977). They found, using data from 120 tropical stations, that the method is only valid when used with climatological data recorded at sites further than 50 km from a coast. At these stations the modified Brutsaert and Stricker formula gave encouraging results, which support the concept of complementary evaporation. Clearly the approach has great potential in areas of sparse data.
The infiltration characteristics of the land surface and the rainfall intensity and duration determine the rate at which the soil moisture store is replenished. After consumptive use by vegetation, a small proportion drains under gravity to the groundwater store. The occurrence of subsurface water can vary according to soil type, the nature of the underlying parent material and the depth of weathering. A classification of subsurface water is given in Figure 15. Water is held in each zone as a result of gravitational surface tension and chemical forces. There are no sharp boundaries, except at the capillary fringe in coarse-grained sediments. The water table is, in fact, a theoretical surface, and can be demonstrated approximately by the level of water in wells which penetrate the saturated zone. The water table can be defined as the level at which the fluid pressure of the pores, in a porous medium, is exactly atmospheric. Below the water table the subsurface water is usually termed groundwater. It can exist in the rock pores to very great depths (ca. 3000 m), but in dense rock the pores are not interconnected and the water will not migrate.
Only a small proportion of the zone of saturation will yield water to wells. The water-bearing portions are called aquifers. Many types of formation can serve as aquifers, a key requirement being the ability to store water in pores. Table 5 gives a typical range of values of porosity, and it is clear that the unconsolidated deposits (chiefly sands and gravels) are the most important aquifers. Pores in the silts and clays are too small. Volcanic rocks are often good aquifers because of the many types of opening which contribute to their permeability. Igneous and metamorphic rocks are generally regarded as poor aquifers but, over large parts of Africa, the Precambrian basement rocks are near the surface and are deeply weathered. These form shallow aquifers of low yield (0.5 to 1 l/sec), sufficient for small domestic supplies and stock watering. The areal extent of the basement complex rocks on the old erosion surfaces makes this type of aquifer extremely important in the context of tropical Africa. Joints and fractures in the crystalline basement hold some water, but storage is usually quite small and recharge is from the surface weathered zone. Therefore, yields tend to be less than or equal to those from the shallow surface aquifers.
Table 5. Typical porosity values for different formations.
| Aquifer type | Porosity (%) | |
| Unconsolidated deposits | ||
| Gravel | 25-40 | |
| Sand | 25-50 | |
| Silt | 35-50 | |
| Clay | 4070 | |
| Rocks | ||
| Fractured basalt | 5-50 | |
| Karst limestone | 5-so | |
| Sandstone | 5-30 | |
| Limestone, dolomite | 0-20 | |
| Shale | 0-10 | |
| Fractured crystalline rock | 0-10 | |
| Dense crystalline rock | 0-5 |
Aquifers may be classified as confined and unconfined, according to whether or not the water is separated from the atmosphere by impermeable material. Confined aquifers often give rise to artesian wells, where the pressure within the aquifer is sufficient to produce flowing wells at the surface. Unconfined aquifers, of course, have water whose upper surface is at atmospheric pressure. The term semiconfined is used for the intermediate condition, where the confining layer is not completely impermeable. Often lenses of unconfined water are encountered above the water table, held by isolated layers of impermeable material. These are termed perched aquifers and the upper surface is a perched water table.
Figure 15. Classifications of subsurface water.
Groundwater may be discharged at the surface or into bodies of surface water. Springs are the most noticeable manifestation of this, but seepage into rivers and lakes is also an important part of the hydrological cycle. Artificial discharge is induced by well digging or borehole drilling. The exploitation of groundwater by these techniques is dealt with in Chapter 6. The quantity of discharge is a function of the porous medium, which is related to the size and interconnection of the pores. The storage term for unconfined aquifers is the ‘specific yield’ defined as the volume of water released from storage per unit surface area of aquifer, per unit decline in water table. The storage coefficient in confined aquifers is the ‘storativity’ – defined as the volume of water released per unit surface area of aquifer, per unit decline in the component of hydraulic head normal to that surface (Freeze and Cherry, 1979). In the context of the hydrological cycle, groundwater flow passes from recharge areas to discharge areas. Fluctuations in the water table introduce transient effects in the flow system. However, it can often be simulated as a steady-state system if the fluctuations in water table are small in comparison with the total vertical thickness of the system (Freeze and Cherry, 1979).
Discharge areas in semi-arid climates can be mapped by the direct field observation of springs and lines of seepage, or by the occurrence of phreatophytes and other distinctive vegetative patterns. An analysis of the lithology, topography and existing borehole data will also give information on the recharge – discharge regime and allow the application of steady-state water balance equations to the surface and subsurface components within the recharge and discharge areas. This approach is often applied to determine the recharge potential within a catchment area and, although livestock requirements are generally very small in comparison with the recharge components, it is a useful exercise to balance all the measured components in order to determine gross errors, or to assess the possible effects of a management programme.
Within the pastoral regions of tropical Africa most streams and rivers are seasonal or ephemeral with only the larger rivers, which rise in heavily forested, highland or plateau areas, being able to sustain perennial flow. Seasonal and ephemeral streams are characterised by having hydrographs with a very rapid rise to peak discharge within a short time of rain, and a still rapid but more gradual recession, so that a large proportion of the total flow occurs in about the first 2 hours of rainfall. The volume of storm runoff depends to a large extent on the antecedent soil moisture conditions and the intensity of rainfall. Typical annual runoff volumes in semi-arid areas, expressed as a percentage of rainfall, would be less than 10%, but individual storms can produce much higher runoff volumes (ca. 70%) when rain falls in an already saturated catchment. Runoff varies widely according to the seasonal distribution of rainfall, catchment characteristics (shape, size, steepness), vegetation type and density, in addition to the two basic criteria mentioned above.
Table 6. Annual runoff as a percentage of rainfall – Kenya.
| Drainage area | Mean annual rainfall (mm) | Mean annual runoff (mm) | Runoff/Rainfall (%) |
| Lake Victoria | 1245 | 149 | 12 |
| Rift Valley | 535 | 6 | 1 |
| Athi River | 585 | 19 | 3 |
| Tana River | 535 | 36 | 7 |
| Ewaso Ngiro | 255 | 4 | 2 |
| Average for Kenya | 500 | 25 | 5 |
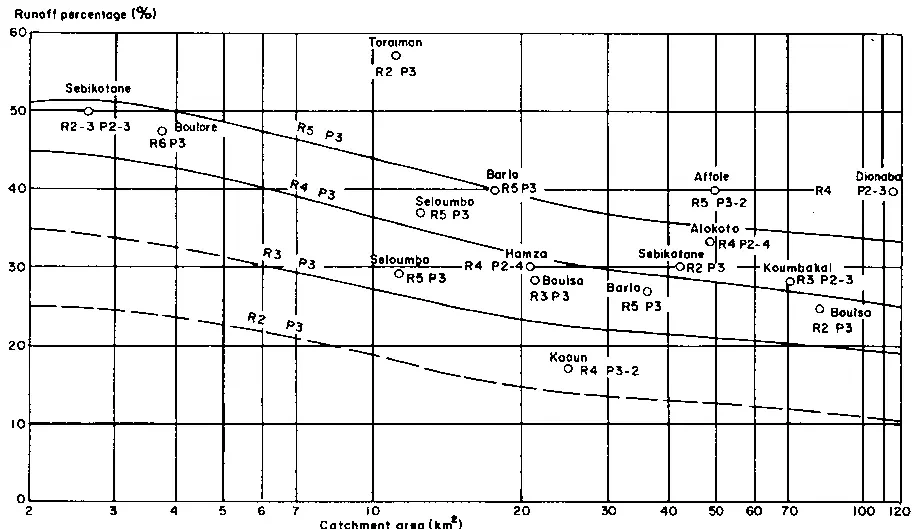
Table 6 shows the annual runoff, expressed as a percentage of annual rainfall, for large catchments in Kenya. Table 7 shows similar percentages for smaller catchments in Malawi. Table 8 gives numerous examples of annual runoff coefficients from the Niger, Congo, Zambezi and Nile basins (Balek, 1977). Figure 16 is a graph of annual runoff coefficients for individual storms against the catchment size for West African stations (Rodier, 1977). Generally speaking, the wide variation of annual totals makes it difficult to predict total catchment yield from rainfall alone. Most attempts to regress runoff against rainfall lead to unacceptable scatter. Actual measurements of runoff and rainfall, on the other hand, can yield acceptable values of annual AE in watertight catchments, where groundwater storage changes very little from year to year. In heterogeneous catchments a general value for AE may not have much validity, but careful measurements, particularly of rainfall, in small homogeneous catchments have led to some of the best estimates of AE (Blackie et al, 1979). While total runoff or streamflow gives the yield of water from a particular catchment in a particular year, it is closely dependent upon variations in annual rainfall. As in the case of rainfall, a set of runoff data can be subjected to a frequency analysis and statements can be made about the probability of occurrence of certain values. More usually, however, interest is centred on the extremes of exceptionally high or low annual runoff events and their duration. In these cases, partial duration series or annual maximum (or minimum) series plotted on extremal probability paper will give the recurrence intervals of particular events. To obtain the duration of annual flows above or below certain limits, an entirely different technique is required. This relies on rainfall being a stochastic process, where the annual rainfall in a particular year is independent of the rainfall in preceding years. Although irregular trends and spells of wetter-than-average or drier-than-average rainfall are commonplace, most attempts to discern reproducible cycles or harmonic patterns in rainfall have failed. In the absence of demonstrable cycles there is no reason to assume that the irregular patterns are other than those which could be expected to occur in an entirely random series from time to time.
Table 7. Annual runoff as percentage of rainfall – Malawi.
| River | Mean annual rainfall (mm) | Mean annual runoff (mm) | Runoff/Rainfall (%) |
| Ruo | 1280 | 395 | 31 |
| Kwakwazi | 1240 | 332 | 27 |
| Likangala | 1430 | 499 | 35 |
| Domasi | 1730 | 882 | 51 |
| Naisi | 1280 | 312 | 24 |
| Linthipe | 880 | 133 | 15 |
| Lilongwe | 930 | 155 | 17 |
| Lingadzi | 810 | 82 | 10 |
| Bua | 900 | 83 | 9 |
| Bua | 900 | 73 | 8 |
| Dwangwa | 740 | 37 | 5 |
| Luweya | 1480 | 500 | 34 |
| Luchelemu | 1090 | 260 | 24 |
| Lunyangwa | 1210 | 232 | 19 |
| N. Rumphi | 1320 | 661 | 50 |
| Kambwiya | 1370 | 625 | 46 |
| N. Rukuru | 910 | 227 | 25 |
It is possible to extend a data set having characteristic statistics of mean and variance by generating a similar sequence of random values. This can be repeated many times and the actual occurrence of runs of values above or below certain limits can be analysed. A good example of this technique in practical use is described by Kidd (1983), who used it to generate synthetic or theoretical inflows into Lake Malawi in order to predict outflow down the Shire River and the effects of controlling outflow with a barrage. Often, as in the case of designing small water supplies, the seasonal variations in daily flow are important. The best way to represent these is by means of a flow-duration curve. This is a cumulative frequency curve of daily flows, expressed as a percentage over as long a period as possible. Figure 17 gives an example of such a curve for daily flows compared with typical curves for monthly and annual mean discharges (USGS, 1959). Thus, it is possible to estimate the percentage of time during which a given flow is equalled or exceeded. In the case of low flows duration of flow is particularly important. It is often necessary to know what the minimum flow would be over a certain time with a given level of occurrence. Thus for a water supply scheme, 30 days might be the absolute maximum that either stock or people could survive on storage. The 5-year, 30-day minimum flow can be compared with the demand to see what supplementary measures (boreholes, shallow wells) are necessary, on average, in a 5-year period. This statistic and other comparable statistics (e.g. 10-year, 60-day minimum flow) can be calculated by a frequency analysis of overlapping ‘n’-day flows in a given run of data. This is best performed on a computer because of the amount of data involved. Where a long dry season occurs, as in much of tropical Africa, a visual inspection of the recession curves of the streams is usually sufficient to gain some idea of the frequency of very low flows of specified duration. It is necessary to know the peak flow or flood for the design of any structure intended to pass a given volume of water per unit time (e.g. spill ways on dams, culverts, canals and bridges). Many empirical and analytical techniques are available to predict floods. It is outside the scope of this report to discuss more than the general principles. Readers interested in this topic will find a comprehensive treatment of the subject in NERC (1975), in spite of the direct relevance of this report to British conditions. The proceedings of the symposium on ‘Flood hydrology’ (TRRL, 1977) deals specifically with African conditions, and applies similar techniques of flood prediction to both urban and rural catchments.
Table 8. Annual runoff as a percentage of rainfall – Niger, Congo, Zambezi and Nile basins.
| River | Location | Drainage area (km2) | Precipitation (mm) | Runoff (mm) | Runoff coefficient (%) | Mean annual discharge (m3/s) |
| Water balance of Niger basin | ||||||
| Niger | Sigiri | 70000 | 1640 | 420 | 25 | 931 |
| Interbasin | Sigiri-Koulikouro | 50000 | 1424 | 393 | 28 | 624 |
| Niger | Koulikouro | 120000 | 1550 | 409 | 26 | 1555 |
| Interbasin | Koulikouro-below mouth of Bani | 102600 | 1235 | 235 | 19 | 770 |
| Niger | below Bani | 222600 | 1405 | 328 | 23 | 2325 |
| Interbasin | Bani-Benue | 501400 | 964 | 35 | 4 | 532 |
| Niger | above Benue | 724000 | 1100 | 126 | 11 | 2877 |
| Benue | Mouth | 319000 | 1495 | 343 | 23 | 3477 |
| Niger | below Benue | 1043000 | 1221 | 192 | 16 | 6354 |
| Interbasin | Benue mouth of Niger | 48000 | 1880 | 375 | 20 | 571 |
| Niger | mouth to Gulf of Benin | 1091000 | 1250 | 198 | 16 | 6925 |
| Water balance of Congo basin | ||||||
| Chambeshi | above Bangweulu Swamps | 43830 | 1143 | 241 | 21 | 337 |
| Interbasin | Bangweulu Swamps | 57664 | 1229 | 59 | 5 | 110 |
| Luapula | below Bangweulu Swamps | 101494 | 1191 | 138 | 12 | 441 |
| Interbasin | Bangweulu S.-Mweru L. | 71372 | 1165 | 136 | 12 | 307 |
| Luapula | at Mweru L. | 172866 | 1181 | 138 | 12 | 754 |
| Kalungwishi | Mweru (mouth to) | 26696 | 1143 | 164 | 14 | 139 |
| Interbasin | Kalungwishi-Lualaba | 123734 | 1160 | 132 | 11 | 520 |
| Luvua | Confluence with Lualaba | 296600 | 1172 | 136 | 12 | 1274 |
| Lualaba | Uzilo | 16300 | 1100 | 200 | 18 | 103 |
| Lufiva | Comet Falls | 11980 | 1180 | 126 | 11 | 48 |
| Lualaba | above Luvua | 187800 | 1130 | 110 | 10 | 651 |
| Lualaba | belong Luvua | 484400 | 1156 | 126 | 11 | 1931 |
| Interbasin | Luvua-Lukuga | 7200 | 1125 | 108 | 10 | 24 |
| Lualaba | above Lukuga | 491600 | 1155 | 125 | 11 | 1955 |
| Lukuga | mouth to Lualaba | 270900 | 1062 | 32 | 3 | 271 |
| Lualaba | belong Lukuga | 762500 | 1122 | 91 | 8 | 2226 |
| Interbasin | Lukuga-Lowani | 277083 | 1905 | 602 | 32 | 5295 |
| Lualaba | above Lowani | 989583 | 1399 | 239 | 17 | 7521 |
| Lowani | Mouth | 95830 | 1675 | 274 | 16 | 837 |
| Congo | confluence Lowani-Lualaba | 1085413 | 1422 | 249 | 17 | 8358 |
| Interbasin | confluence Ubangi | 463000 | 1875 | 482 | 26 | 7126 |
| Congo | above Ubangi | 1548413 | 1559 | 315 | 20 | 15484 |
| Ubangi | Mouth | 754830 | 1597 | 248 | 16 | 5936 |
| Congo | below Ubangi | 2303243 | 1569 | 293 | 19 | 21420 |
| Interbasin | Ubangi-Sanga | 9580 | 1750 | 355 | 20 | 108 |
| Congo | above Sanga | 2312823 | 1561 | 293 | 19 | 21528 |
| Sanga | Mouth | 213400 | 1580 | 362 | 23 | 2471 |
| Interbasin | Sanga-Kwa | 109500 | 1750 | 375 | 21 | 1304 |
| Congo | Kwa | 2635723 | 1581 | 301 | 19 | 3303 |
| Kwa | Mouth | 881887 | 1538 | 350 | 23 | 9873 |
| Congo | below Kwa | 3517610 | 1570 | 314 | 20 | 25176 |
| Interbasin | Kwa-mouth of Congo | 89840 | 1300 | 220 | 17 | 629 |
| Congo | Mouth | 3607450 | 1561 | 313 | 20 | 38805 |
| Water balance of Zambezi basin | ||||||
| Zambezi | Chavuma Falls | 75967 | 1288 | 231 | 18 | 555 |
| Interbasin | Chavuma Falls-Chobe | 284538 | 1030 | 61 | 16 | 541 |
| Zambezi | above Chobe | 360505 | 1085 | 95 | 9 | 1096 |
| Chobe | Mouth | 870758a | 625b | 3 | 1 | 135 |
| Zambezi | below Chobe | 1231263 | 760 | 30 | 5 | 1231 |
| Interbasin | Chobe-Vict. Falls | 5317 | 605 | 21 | 3 | 6 |
| Zambezi | Victoria Falls | 1236580 | 759 | 30 | 4 | 1237 |
| Interbasin | Victoria F.-Kafue | 163380 | 718 | 54 | 8 | 261 |
| Zambezi | above Kafue | 1399960 | 754 | 34 | 5 | 1498 |
| Kafue | mouth to Zambezi | 154856 | 1023 | 85 | 8 | 417 |
| Zambezi | below Kafue | 1554816 | 782 | 38 | 5 | 1915 |
| Interbasin | Kafue-Luangwa | 19091 | 1198 | 25 | 2 | 151 |
| Zambezi | above mouth Luangwa | 1573907 | 787 | 41 | 5 | 2066 |
| Luangwa | Mouth | 148326 | 925 | 91 | 10 | 436 |
| Zambezi | below Luangwa | 1722233 | 799 | 44 | 6 | 2501 |
| Water balance of Nile basin | ||||||
| Victoria Nile | Ripon Falls | 269000 | 1302 | 81 | 6 | 699 |
| Semliki | above confluence with Victoria Nile | 22500 | 1395 | 88 | 6 | 63 |
| Albert Nile | below Albert Lake | 281500 | 1309 | 85 | 6 | 762 |
| Interbasin | Albert Lake-Mongalla | 184500 | 1228 | 20 | 2 | 111 |
| White Nile | Mongalla | 466000 | 1277 | 60 | 5 | 874 |
| Interbasin | Mongalla-Sobat | 438800 | 900 | -38 | – | -511 |
| White Nile | above Sobat | 904800 | 1094 | 12 | 1 | 362 |
| Sobat | Mouth | 187200 | 1081 | 71 | 7 | 431 |
| White Nile | below Sobat | 1092000 | 1091 | 22 | 2 | 793 |
| Interbasin | Sobat-Blue Nile | 343000 | 500 | 0 | 0 | 0 |
| White Nile | above Blue Nile | 1435000 | 710 | 16 | 2 | 793 |
| Blue Nile | confluence with W. Nile | 324530 | 1082 | 158 | 15 | 1727 |
| Nile | below confluence with Blue Nile | 1759530 | 778 | 43 | 6 | 2420 |
| Interbasin | confluence Aswan | 79470 | 1080 | 97 | 9 | 244 |
| Nile | Aswan | 1839000 | 790 | 45 | 6 | 2664 |
| Interbasin | Aswan mouth | 1042000 | 7 | -18 | – | 71 |
| Nile | Mouth | 2881000 | 506 | 28 | 6 | 2593 |
a with Northern Kalahari
b Chobe basin only, 798 mm
Source: Balek (1977).
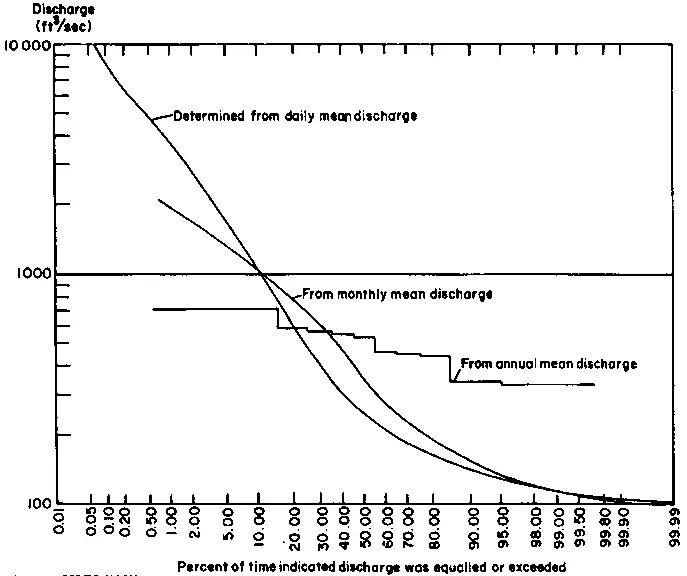
Basically, a choice can be made between empirical techniques based on catchment characteristics, statistical techniques (where there is an abundance of reliable data), and unit-hydrograph techniques (which require some knowledge of rainfall characteristics, soil types, channel slope and shape of the unit hydrograph). Figure 18 shows a flow diagram for the process of estimating a design flood using either the statistical or the unit-hydrograph approach. For further details NERC (1975) should be consulted. In many areas throughout tropical Africa there are insufficient streamflow records for statistical techniques to be applied with confidence. Usually statements are required about ungauged catchments where a large degree of uncertainty is bound to arise. Choice of method depends to a large extent, therefore, on the amount and type of data available. It is still common to find the so-called ‘rational method’ being applied where sufficient data for other methods are lacking (Prabhakar, 1977). In this method, maximum runoff (Qmax) is related to average rainfall intensity (I) and catchment area (A) by means of an empirical runoff coefficient (K):
Qmax = K.I.A
Values of K are derived locally, often by trial and error, and values for Kenya conditions are given in Table 9.
Table 9 Empirical values of the factor K in the rational formula.
| Type of catchment | Empirical values of factor K |
| Rocky and impermeable | 0.30 to 1.00 |
| Slightly permeable, bare | 0.60 to 0.80 |
| Slightly permeable, partly cultivated or covered with vegetation | 0.40 to 0.60 |
| Cultivated absorbent soil | 0.30 to 0.40 |
| Sandy absorbent soil | 0.20 to 0.30 |
| Heavy forest | 0.10 to 0.20 |
Source: Prabhakar (l977).
Another method, used when data are lacking, is the ‘envelope curve’ method in which recorded peak flows are plotted against catchment area. Figure 19 shows such a curve for Kenya (Prabhakar, 1977). Although a remarkable degree of conformity is often found, it is not possible with this method to relate magnitude to frequency of occurrence; but from experience, the line marked A-B in the diagram is expected to give approximately the 25-year flood.
Implicit in many analyses of streamflow is a division between surface runoff, or storm runoff, and baseflow. As the name implies, surface runoff is the direct runoff from the soil surface to the stream course, concentrated by the shape of the catchment and the drainage network into a flood wave which reaches a maximum and then attenuates as it travels down the main river. Baseflow, on the other hand, is conventionally taken as the contribution to streamflow from groundwater. After the passage of the flood wave, the catchment slowly drains until the flow in the river is related to the amount of water held in storage within the catchment. The ‘recession curve’, the slowly falling limb of the hydrograph, therefore, reflects the rate of release of water from the groundwater store, which is itself dependent upon a combination of hydraulic head and saturated permeability of the catchment. The exponential shape of a recession curve allows ‘recession constants’ to be calculated. These in turn can be used to predict the amount of water in the groundwater store, since the physical process of releasing water from storage can be simulated by a linear ‘reservoir’ (in systems terminology) whose outflow is directly related to storage:
Qt = QoKrt
where
Qt = flow at time t after Qo, and
Kr = recession constant.
The storage (St) remaining in a basin at time t is given by:
St = – Qt/lnKr
The recession constant can be used, therefore, both to separate stormflow and baseflow (by extrapolating backwards in time from the recession limb of the hydrography and to estimate the groundwater storage at a given time. The latter technique is often used in water balance calculations, as will be seen below.
Measurement of streamflow
Although hydrometric networks in tropical Africa have improved over the past 30 years, the majority of gauging stations are still on large rivers or in areas of high agricultural potential, where information is required for water supply and/or irrigation. In the rangelands not only are networks sparse, but the preponderance of shifting controls (e.g. sandy river beds), coupled with infrequent visits, lowers the reliability of the streamflow records.
 0
0
In ungauged catchments, which are often of very small size, it is frequently necessary to estimate either storm runoff or streamflow. Once again there is a choice of methods, depending on the type of information required and the availability of data from nearby stations within the same hydrological region. These range from the statistical, analytical and empirical techniques referred to in the last section to mathematical models of various degrees of complexity, which are dealt with later in this report. However, the actual measurement of streamflow is better than the most sophisticated indirect methods, although usually a combination of the two is used to derive estimates of frequency or reliability. Measuring the flow in a river is straightforward if the river is shallow enough for wading. The basic problem is that of obtaining a unique relationship between height of the water above a datum and discharge. Weirs and flumes are structures which stabilise the channel section to give this unique relationship. For very small streams with a discharge up to 0.12 m3. sec-1, portable “v”-notch weirs can often be installed (British Standards Institution, 1965), which will measure discharge (flow per unit time) for a given depth of flow over the weir. Where the benefits to be accrued do not warrant the construction of weirs or flumes, the natural channel has to be ‘calibrated’. This is achieved by making a series of measurements of discharge, using a current meter, at different ‘stages’ (i.e. at different heights of water above the zero-flow datum). These values can be plotted on a graph of discharge against stage (Figure 20), to give a smooth curve (the ‘storage-discharge’ or ‘rating’ curve). This curve can be extended using the Manning formula, which relates discharge to the slope of the channel and its conveyance (Ven te Chow, 1964). Once the rating curve is established, continuous or periodic measurement of a stage can be readily converted into discharge.
The choice of channel section is important in order to ensure, as far as possible, that the flow remains uniform, and that a ‘control’ governs the stage-discharge relationship throughout its range by eliminating the effects of downstream channel features. Such controls can be rock bars or constrictions of the stream channel which are characterised by having pools or smooth reaches upstream. Where such natural constrictions do not exist, long, straight reaches with stable beds should be sought. It is possible with the latter, however, that the control may be drowned out at high flows causing a change in the stage-discharge relationship.
Erosion and sedimentation
No discussion of surface water in tropical Africa would be complete without reference to erosion and sedimentation. In the humid tropics good management can usually succeed in maintaining a protective vegetative cover. In the semi-arid areas there is a delicate seasonal balance between available moisture and vegetation cover. The slightest change in this balance can begin a chain reaction of removal of cover, surface sealing, decreased infiltration, increased surface runoff, less soil moisture available for plant growth etc. With the removal of vegetation, surface soils are quickly removed by the impact of intense rainstorms and are readily transported by surface runoff. Flow concentrates into rills, rills into gulleys, gulleys into stream bank erosion; until large quantities of material are being transported as either suspended sediment or bed load. Within a very short time all the nutrient bearing soil horizons are removed, leaving pavements of rock fragments or other large particles which are too heavy to remove by raindrop impact and surface runoff. This change can be induced by climatic factors, by man, or more usually by a combination of both. Some experiments have shown that the process can be partially reversed by simple management techniques (Bogdan and Pratt, 1967). It does not necessarily follow, however, that a recovery of vegetation will lead to a complete recovery of infiltration rates and of available water capacity. The hydrological regime may be irreversibly changed, with serious consequences for seasonal availability of streamflow. Another feature of accelerated erosion is the destructive power of rivers in flood. Changes in course, undermining of embankments, bridges or spillways, and the destruction of vegetation or of human habitations are commonplace throughout the semi-arid tropics. In the wake of the destructive flood wave, flows decrease, following the pattern of the recession limb of the hydrograph. Gradually decreasing velocities cause the river to drop its charge of sediment, rapidly filling up surface water reservoirs, diversion weirs, irrigation channels and any water control features. The effects of erosion and deposition, therefore, must be taken into account in any development of surface water resources. Clearly, there is little point in investing in surface water in a catchment which is suffering from accelerated erosion until a management plan for soil and water conservation is implemented over the whole catchment. In marginal areas the expense of implementing such a plan would certainly rule out the surface water option.
The measurement of sedimentation (embodying the processes of erosion, entrainment, transportation and deposition) is a complex subject, and one of the best summaries of the ‘state of the art’ can be found in the manual on Sedimentation Engineering produced by the American Society of Civil Engineers (ASCE, 1977). The financial cost of damage produced by sedimentation in the United States of America is enormous. The total average damage from deposition in 1948 was quoted in the above text as being US$ 174 000 000, and the average annual flood damage as US$ 100 657 000 for the 20-year period between 1925 and 1944. This gives some idea of the magnitude of the problem in a region where erosion control programmes are active. It is impossible to say what the figure would be for damage to agricultural land, cost of maintenance or impairment of the capital value of irrigation and drainage enterprises, damage to storage reservoirs used for power, water supply, irrigation, flood control and multiple purposes in the African continent as a whole. The impact on food and animal production must also be very great and, yet, it is still extremely difficult to focus attention and to channel development funds into soil and water conservation.
The water balance
The general expression describing the water balance of a watertight catchment over a given period is:
R = Q + AE + D S + D G
where
R, Q are precipitation and streamflow respectively and can usually be measured directly;
AE is actual evaporation and transpiration; and
D S, D G are changes in soil moisture and groundwater storage respectively.
Where no bias is present in any of the measured terms this expression can be used to determine the value of any one term, by difference, over a given period. There will be a random error present, of course, which is dependent on the precision of the instruments, the efficiency of the sampling networks and the extent to which D S or D G can be measured in the catchment. In regions which experience a long dry season the differences from year to year between soil moisture storage at the end of the dry season are usually very small. Similarly, groundwater storage tends to return to a minimum storage state at the end of the dry season. Exceptions occur when the groundwater store drains out excessively during a drought period. On return to wet conditions a proportion of the storage input is required to top up the stores to a more usual state. Conversely, during a very wet period the groundwater storage is not depleted so fully, and there is a surplus of recharge which tends to drain rapidly. These features are recognizable in the baseflow recession of the stream. By using the composite recession curve an estimate of the groundwater storage can be made (Figure 22).
As mentioned previously, the actual evaporation (AK) term is the term most commonly estimated by the water balance method (Blackie et al, 1979). By choosing a ‘water year’, i.e. a period of approximately 1 year running from the end of one dry season to the end of the next, consecutive estimates of annual AE can be obtained. For shorter-period estimations of AE detailed soil moisture records are required, and it is more usual to distribute the annual total according to an empirical seasonal model in the absence of direct measurements of AE.
Water balance has also been used to estimate groundwater recharge (Lloyd et al, 1967) in an arid area of northeast Jordan. The authors estimated that, on average, 8.2% of the annual rainfall reached the aquifers – which is in agreement with two previous estimates obtained using different techniques.
If the development of a particular aquifer involves the abstraction of a quantity of water even approaching its recharge potential, the water balance should be used as an additional check to avoid overexploitation of the resource. Generally speaking, unless a large well field is contemplated for an urban area, the abstraction rates are likely to be well below the recharge potential. Israel is one country where abstraction is dangerously close to the rate of recharge, and careful monitoring of pumping is carried out along the coastal aquifers to prevent the intrusion of saline groundwater from the Mediterranean interface (Webster, 1971).
The water balance equation also provides the basic framework for mathematical modelling of the hydrological cycle. Such models are usually stochastic-conceptual (see Clarke, 1973, for a full discussion of the use of mathematical models in hydrology): ‘stochastic’ because the chance of occurrence of the variables is taken into consideration and the concept of probability is introduced; and ‘conceptual’ because the form of the model is suggested by consideration of the physical processes acting on the input variable(s) to produce the output variable(s).
The unit-hydrograph approach to flood prediction, on the other hand, may be termed a deterministic-empirical model, if all variables are regarded as free from random variation (‘deterministic’) and the model is formulated without reference to the physical processes (’empirical’) (see O’Donnell, 1966; Dooge, 1965). Where discharge records are short, and longer records of rainfall are available, a stochastic-conceptual model can be formulated in which the parameters are estimated for the period of common data. The longer rainfall records can then be used to extend the discharge period. Kidd (1983) gives a good example of these techniques applied to African conditions, whereas Blackie (1972) demonstrates a deterministic-conceptual model applied to the water balance of East African catchments.
Simple deterministic models can often be formulated to solve unknown variables in the water balance (Lloyd et al, 1967), but in order to introduce any element of probability (i.e. reliability), in e.g. estimating recharge or actual evaporation, it is necessary to introduce stochastic techniques unless exceptionally long periods of records are available.
Here again, the type of model must be suited to the end product desired, to the quantity and quality of data available, and to a cost-benefit analysis of exploiting a water resource with or without a knowledge of the risks involved. The need for immediate practical benefits and the lack of data usually call for the use of mathematical models in most applications to livestock development. As investment costs increase, it is wise to examine the implications of proceeding without some examination of the medium- and long-term effects of an expensive system of exploitation. An understanding of the hydrological cycle, therefore, and the quantification of the various components in the form of a water balance, should be an essential prerequisite of all large-scale management plans.


Comments are closed.